
Aa Reading preferences
This practical guide is designed for momo shops, cafés, food trucks, hotels, caterers, QSRs and cloud kitchens. It provides a sample cost sheet, an illustrative worked calculation and questions that help you distinguish recipe cost, actual food cost, contribution margin and outlet profit. Numbers are hypothetical and are not Momo Delights supplier prices, retail prices or franchise earnings.
If you are considering externally supplied products, begin with the Momo Delights HoReCa and B2B enquiry page to request an actual dated quotation and specification. For the alternative, see momo machine versus ready-made momos, which discusses the make-or-buy decision.
Four costs restaurant owners should not confuse
| Term | What it measures | What it does not prove |
|---|---|---|
| Ingredient/recipe cost | Food inputs assigned to one standard serving | That the kitchen actually uses the standard quantity |
| Actual food cost | Food inventory consumed over a period compared with food sales | That every dish has the same cost percentage |
| Contribution margin | Revenue minus relevant variable costs | Net profit after rent, fixed staff costs and other overhead |
| Operating profit | Revenue remaining after the defined operating cost categories | Cash returned to an owner after tax, debt, capex and working-capital movements |
The distinction matters because a six-piece momo plate that looks profitable from its raw dumpling cost can lose much of that contribution to sauces, breakage, delivery commissions or discounts. Restaurant India’s 2026 discussion of menu engineering emphasises contribution margin alongside food cost percentage: a high-volume item with a useful contribution can be commercially important even if its food cost rate differs from another dish’s rate.
Five core momo costing formulas
1. Purchase cost per usable momo
Cost per usable piece = total landed cost of a pack ÷ number of usable pieces.
Use landed cost when freight and other directly attributable costs belong to the pack. Count unusable or damaged pieces rather than pretending all pieces will be sold. If the kitchen produces momos itself, replace pack cost with the batch’s accurately measured food input cost and account for batch yield.
2. Cost of momos for one plate
Base dumpling cost per plate = usable-piece cost × pieces served.
Standardise the number of pieces. A menu that occasionally gives seven instead of six without a documented promotion will drift away from the recipe cost even when the pack price stays unchanged.
3. Total ingredient cost per serving
Food ingredient cost = dumpling cost + chutney + seasoning + frying oil absorbed/allocated + garnishes and other edible components. Treat packaging separately for clarity, then combine costs when evaluating a channel-specific order. Oil accounting should use a defensible measured or allocated usage method, not the full fryer-fill cost charged to every plate.
4. Recipe food cost percentage
Recipe food cost % = food ingredient cost ÷ net food sales price × 100. Use a consistent price basis, excluding taxes collected on behalf of government where required, and be clear whether discounts change the net price.
5. Contribution per sale
Contribution = realised revenue − relevant variable costs. Variable costs may include food, packaging, channel commissions, per-order payment charges and any other costs that vary with sales. Fixed wages, rent and baseline utilities are then covered from the pooled contribution across orders.
Worked example: pricing a six-piece momo plate
Every amount in this example is fictional for teaching purposes, not a Momo Delights price, quotation, cost record or margin. Assume a restaurant pays ₹480 for a pack nominally containing 80 momos. Four pieces are unusable from breakage or other reasons, leaving 76 saleable pieces. The restaurant serves six momos per plate at a hypothetical realised food selling price of ₹180.
| Input | Illustrative value | Calculation / treatment |
|---|---|---|
| Pack landed cost | ₹480 | Purchase + attributable delivery in this hypothetical example |
| Nominal pack count | 80 pieces | Provided in the hypothetical specification |
| Unusable pieces | 4 pieces | 5% loss of nominal count |
| Usable pieces | 76 | 80 − 4 |
| Effective cost per piece | ₹6.32 | ₹480 ÷ 76, rounded |
| Six momos per plate | ₹37.89 | ₹480 ÷ 76 × 6 |
| Chutney | ₹8.00 | Hypothetical portion recipe cost |
| Oil/edible finishing input | ₹3.00 | Hypothetical allocated food cost |
| Food ingredient cost | ₹48.89 | ₹37.89 + ₹8 + ₹3 |
| Takeaway packaging | ₹10.00 | Separate channel-related cost |
| Food + packaging | ₹58.89 | Before commissions and other variable expenses |
| Illustrative realised price | ₹180.00 | Assume consistent tax treatment and no discount |
In this example, recipe food cost percentage ≈ 27.2% (₹48.89 ÷ ₹180 × 100). Food plus packaging is approximately 32.7% of revenue. The contribution before channel commission and other variable charges is approximately ₹121.11 (₹180 − ₹58.89). That is not net profit and is not a forecast of any real outlet.
Why did breakage matter? Without the four lost pieces, the six-dumpling base cost would have been only ₹36.00. The difference may seem small per plate, but repeated wastage accumulates across many orders. This is why the buyer should know whether a supplier’s low quoted price translates to a high rate of saleable pieces.
What if you make momos from scratch?
In-house production should be costed at batch level, then divided by the number of usable finished dumplings. Document the actual purchase unit and usage for flour, vegetables or paneer, oil, spices and other ingredients. The largest source of error is often a vague recipe such as “one bowl of cabbage” or “a handful of filling” that cannot be measured repeatedly.
Example of a measurement template, not a tested recipe:
| Ingredient / input | Record | Formula |
|---|---|---|
| Flour | Grams used; price per kilogram | Grams ÷ 1,000 × price/kg |
| Vegetables / paneer | Usable grams after trimming; ingredient purchase price | Account for yield and quantity consumed |
| Ginger, garlic, spices | Measured quantity or documented batch allocation | Usage × purchase unit cost |
| Filling oil | Measured edible oil used in the batch | Usage × purchase unit cost |
| Total batch ingredient cost | Sum of all edible inputs | Σ ingredient cost |
| Usable finished momo count | Count after folding, cooking or required loss assessment | Total batch cost ÷ saleable count |
Then add sauce and finishing costs for the served plate. Labour for kneading, chopping, folding, cleaning and training should be separately measured as part of a full make-versus-buy decision. Do not claim homemade momos are automatically less expensive than supplied ones without comparing all costs on the same basis.
Dine-in, takeaway and delivery have different economics
A dish might have the same food ingredients across channels while generating different contributions. Dine-in has table service and cleaning demands; takeaway adds packaging; delivery can add packaging, promotions, channel commissions and payment fees. A menu owner should compare the realised net revenue and variable expenses on the same terms rather than assuming a higher app list price means more profit.
As a separate hypothetical extension, suppose a third-party platform charged 22% of a ₹180 realised revenue base in the above example; the fee would be ₹39.60 and the remaining contribution would fall to approximately ₹81.51 before other costs. The 22% is only an illustrative assumption, not a claim about Swiggy, Zomato, Momo Delights or any particular contract. Actual contract terms, discount funding, tax treatment and charge bases vary.
Analyse margins by order type:
- Dine-in: ingredient cost, staff service allocation and expected losses.
- Takeaway: ingredient cost, packaging, pickup-related overhead and any direct transaction fees.
- Aggregator delivery: ingredient cost, packaging, actual channel charges, platform-funded versus restaurant-funded discounts and returns/refunds.
- Bulk/catering: discounted price, larger-batch efficiency, logistics, labour, order minimum and wastage.
Recipe cost versus actual food cost: why the numbers differ
A recipe sheet estimates how much food should be consumed if each portion is made to the standard. The inventory-based calculation measures how much inventory actually left the kitchen over a period. They differ due to waste, rework, staff meals, stock count errors, theft, expired stock, unrecorded transfers and inconsistent portions.
For an accounting period, a commonly used simplified formula is cost of goods consumed = opening food inventory + food purchases − closing food inventory, adjusted for any transfers or other recorded inventory movements. Actual food cost % = food COGS ÷ comparable food sales × 100. This approach is discussed in Indian restaurant cost-control guidance, including Restaurant India’s menu-engineering analysis and DinePilot’s discussion of theoretical versus actual food cost.
Do not compare a recipe cost that excludes staff meals with inventory COGS that includes them without adjusting the definitions. Track what goes into the numerator and denominator. An apparent change in cost may reflect stock-accounting timing rather than a real deterioration in kitchen performance.
How to reduce momo cost per serving without harming the product
Waste reduction is usually a more defensible starting point than making the filling smaller without informing customers. Consider the following operating controls:
- Standardise portion count and piece weight. Use a documented serving specification and check a sample of plates.
- Record usable yield. Count broken and rejected pieces with reasons instead of hiding loss.
- Measure sauce portions. A consistently overfilled dip cup can quietly raise each plate’s cost.
- Use a controlled cooking SOP. Incorrect steaming or frying can lead to torn wrappers and rejected plates.
- Match batch sizes to demand. Overproduction can cause spoilage or declining quality.
- Buy against actual sales mix. Forecast veg, paneer, tandoori and other styles separately rather than assuming equal demand.
- Audit delivery packaging. Choose suitable, food-safe packs that maintain quality without unnecessary cost.
- Review supplier specifications. Compare usable yield, piece weight and service quality—not merely price per carton.
Cost-saving must not weaken food safety. Apply appropriate storage, cooking, allergen and hygiene controls consistent with FSSAI’s hygiene requirements.
Menu engineering: what should a momo shop promote?
A restaurant should evaluate at least two dimensions: how often an item sells and how much contribution it generates per order. A high-selling item with low contribution may need process changes or thoughtful pricing; a high-contribution but rarely chosen dish may need clearer menu placement or an improved description. Low-demand, low-contribution items deserve a deeper review before taking valuable kitchen capacity.
The approach is more useful than simply promoting the item with the highest percentage margin. A consistently popular plate that contributes ₹80 may produce more total contribution than a plate earning ₹120 that almost nobody orders. But the decision still depends on operational capacity, customer satisfaction and wider menu strategy—not a guaranteed relationship.
Use a sample menu analysis table:
| Menu item | Monthly orders | Contribution per order | Total contribution |
|---|---|---|---|
| Item A (fictional) | 500 | ₹60 | ₹30,000 |
| Item B (fictional) | 180 | ₹110 | ₹19,800 |
| Item C (fictional) | 70 | ₹95 | ₹6,650 |
The figures are hypothetical and do not describe any real brand or outlet. They demonstrate why both demand and contribution matter. Revisit the data after supplier price changes, new promotions, seasonal shifts or menu launches.
Copyable momo costing sheet: columns to maintain
For each SKU, keep a table or spreadsheet with these fields. Use consistent units and dates so the sheet can be reviewed without guessing:
| Group | Recommended columns |
|---|---|
| Product identity | SKU, filling, wrapper, serving count, outlet, date |
| Procurement / batch | Supplier/batch, pieces/pack or recipe yield, invoice cost, freight, defects |
| Food inputs | Base momo, chutney, sauce, oil, seasoning, garnish |
| Channel costs | Packaging, payment fee, platform charge, restaurant-funded discount |
| Sales data | Net realised revenue, number of orders, refunds, channel split |
| Performance | Cost/plate, food cost %, contribution/order, monthly contribution |
| Control | Last cost update, variance, owner, corrective action, next review |
With this approach a momo outlet can respond to a price increase, a changed serving size or a delivery promotion using numbers rather than guesses. It also makes supplier discussions more specific. The Momo Delights business supply team can be asked about current product specifications, order volumes and commercial terms; the blog does not substitute for a quotation.
Momo cost and menu pricing FAQs
How do you calculate cost per momo?
Divide the landed cost of a pack or batch by the number of usable, saleable dumplings. Include actual waste and consistent purchasing units.
How do I calculate the cost of a six-piece momo plate?
Multiply usable cost per piece by six and add the relevant edible inputs such as chutney, finishing oil and garnishes; track packaging and channel fees separately.
Is food cost percentage the same as profit margin?
No. Food cost covers ingredients; profit calculations must consider other operating costs and the actual revenue basis.
What food cost percentage should a momo outlet target?
There is no universally correct target. Establish it from actual rent, wages, sales mix, ingredient costs, channel charges and needed contribution; do not copy an industry range blindly.
Does a lower wholesale price guarantee a cheaper plate?
No. Piece size, breakage, sauce, transport, cooking performance and waste can change the effective cost of each saleable serving.
Should packaging be included in recipe food cost?
Tracking it separately improves clarity. Include it in channel-specific variable cost and contribution calculations.
How do discounts affect momo pricing?
They reduce realised revenue unless funded by another party. Recalculate contributions using the actual amount the restaurant receives and the contractually applicable charges.
How often should cost sheets be updated?
Update whenever key supplier prices, recipes or serving sizes change, and review high-volume items regularly using actual sales and inventory data.
Can a restaurant calculate profit from price minus food cost?
No. The difference still has to pay labour, rent, utilities, technology, advertising, financing and other obligations.
Does Momo Delights publish B2B momo prices here?
No. For actual current specifications and quotes, use the brand’s official B2B enquiry page.
Research sources and editorial note
- Restaurant India — Menu Engineering and Contribution Margin (2026): food cost versus contribution framework.
- DinePilot — Theoretical and Actual Food Cost (2026): stock-count and food cost monitoring examples.
- FSSAI — Hygiene Requirements: food handling principles that cannot be sacrificed for cost savings.
- Momo Delights — HoReCa/B2B Supply: current business enquiry channel.
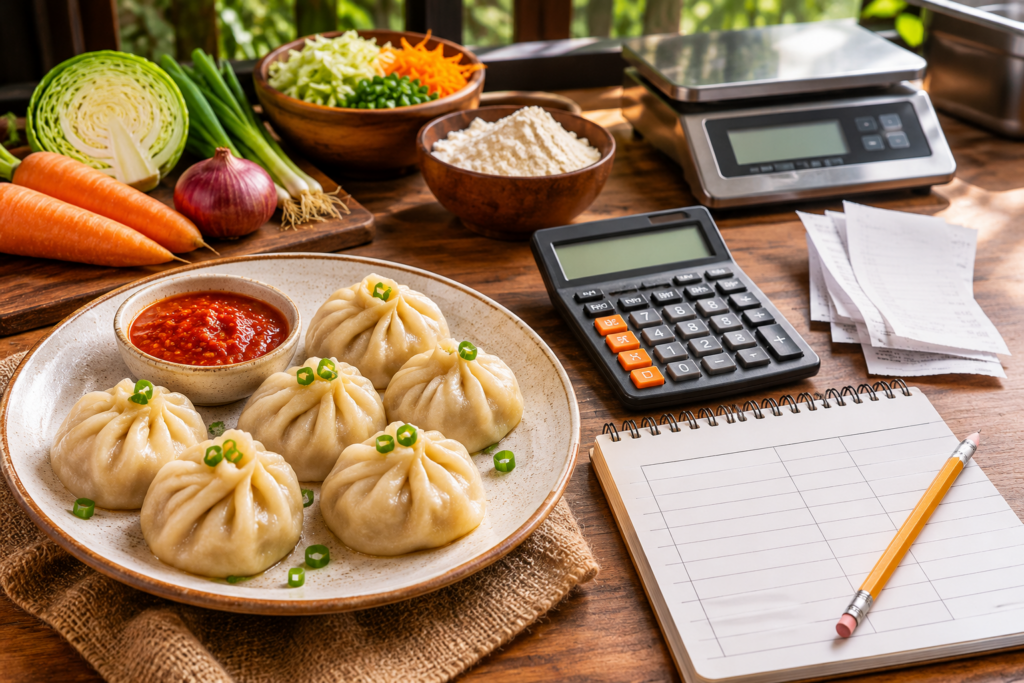
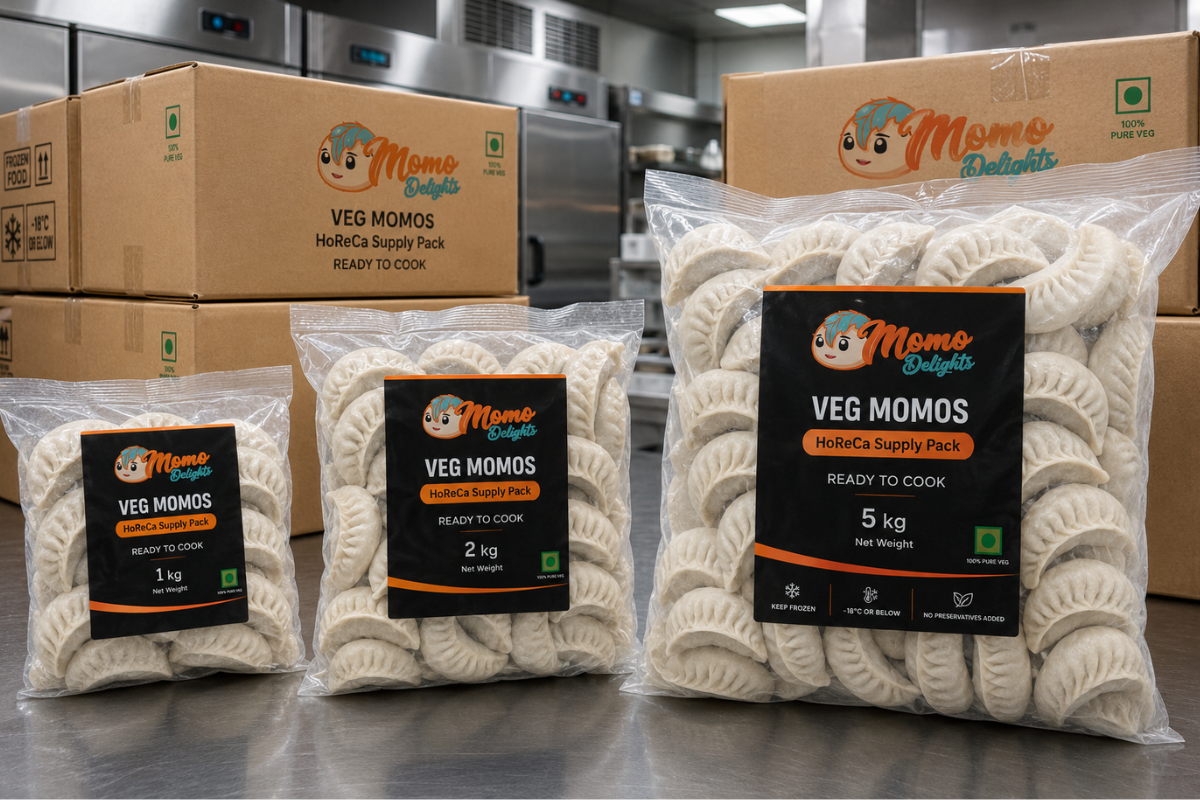
Editorial transparency, 1 November 2026: All worked rupee amounts, commission assumptions, quantities and commercial scenarios are fictional. They are teaching illustrations, not actual Momo Delights supplier prices, consumer menu prices, sales records or projected returns. The featured image is AI-generated conceptual photography; the inline image is an existing brand media asset used only for category context.
For more foodservice detail, explore Serving Hot Momos Safely at Parties and Events and What Are Jhol Momos? A Guide to Broth, Achar and Serving. Verify current product documents and safety procedures.